Author Archive

Refi Volume Rising While HARP Numbers Keep Falling

HARP Home Affordable Refinance ProgramKennesaw’s Ashford Capital Partners’ Managing Partners Matthew Riedemann brings you news you can use.

Low mortgage interest rates helped elevate refinance volume throughout the third quarter as demand for the government’s relief refinance program continued to diminish.

Together, Fannie Mae and Freddie Mac reported 389,284 refinances throughout the third quarter, according to their conservator, the Federal Housing Finance Agency (FHFA). The figure compares to a total of 344,507 in the second quarter.

The boost came as mortgage rates remained more or less stable in the 4.1–4.2 percent range, well below averages seen throughout the early second quarter. With rates now hovering around 4 percent, refinancing activity for the fourth quarter is well-positioned to beat out last year’s slump.

As refinance volumes rose, the share of refinances completed through the government’s Home Affordable Refinance Program (HARP) fell further, according to FHFA. The agency’s report shows HARP refinances totaled 44,136 throughout Q3, representing about 11 percent of total refinances. In Q2, HARP refinances totaled 54,040, about 16 percent of total refinance numbers.

Since the program first kicked off in 2009, FHFA estimates HARP refinances have topped 3.2 million. However, interest in the program has steadily fallen in the last year, with the total number of 2014 HARP refinances looking to hit only about one-third of last year’s total—even as FHFA continues its initiative to boost borrower awareness by hosting town hall-style events in certain hard-hit markets.

By FHFA’s estimate, there are more than 722,000 thousand borrowers who have a “strong financial incentive” to refinance, especially with mortgage rates at historical lows. With many Americans paying 1.5 percentage points more in interest than the current market average, the agency estimates those borrowers could save an average of $200 per month on their mortgage payments.

Despite its failing popularity nationwide, HARP refinances continue to account for a sizable share of refinances in certain states. Year-to-date through September, HARP represented 33 percent of total refinances in Georgia and 31 percent of refinances in Florida, nearly double the nationwide share of 16 percent.

HARP numbers also remain relatively strong among underwater borrowers. According to FHFA, 7,577 of Q3 HARP refinances were for consumers with loan-to-value ratios ranging from 105–125 percent, while 4,124 were for mortgages with loan-to-value ratios higher than 125 percent. While both numbers were down slightly from the second quarter, they compare to a much bigger drop in HARP activity among borrowers with 80–105 percent loan-to-value ratios.

Author: Tory Barringer December 1, 2014 http://dsnews.com/news/12-01-2014/refi-volume-rising-harp-numbers-keep-falling

Come back tomorrow to http://www.AshfordCP.com/blog  where Kennesaw’s Ashford Capital Partners’ Managing Partners Matthew Riedemann brings you news you can use.

Freddie Mac: Housing Market Inching Closer to Stability

Freddie Mac Multi-Indicator Market IndexFollowing a slower than expected summer, the U.S. housing market made up some ground in September as most major indicators inched closer to stability.

Freddie Mac released its latest Multi-Indicator Market Index (MiMi), revealing a 0.5 percent uptick in September to a reading of 74.4 after months of slight declines. The most recent improvement puts the index a few points short of the lower threshold for a market considered to be in “stable” territory.

According to Freddie Mac, three of the four major indicators tracked in the index saw improvements in September, led by a 1.2 percent gain in the gauge of labor health to 94. The components measuring payment-to-income ratios and the proportion of mortgage payments made on time also edged up, rising 0.8 percent to 72.7 and 0.5 percent to 66.6, respectively.

Meanwhile, the already weak picture of home purchase applications deteriorated further, falling 0.8 percent to 64.1. As refinances have fallen off from their surge of the last few years, purchase applications have failed to close the gap, resulting in a more anemic mortgage market compared to the housing recovery’s early years.

As of September’s index reading, 14 states and the District of Columbia were in a stable range, with North Dakota (96.5), Washington, D.C. (94.3), Wyoming (91.1), Montana (91.0), and Hawaii (89.3) leading the rest. That compares to 13 states in August’s report.

“Following a similar trend from last month more states and metros continued to show improvement from the very slow summer months,” said Len Kiefer, deputy chief economist at Freddie Mac.

As with the last few reports, only six of the nation’s top 50 metro areas were in a stable range: San Antonio (91.3), Austin (87.6), Salt Lake City (84.4), Houston (84), Los Angeles (83.5), and New Orleans (82).

Meanwhile, a handful of struggling states—including Nevada, which ranks lowest in stability with a MiMi value of 54.6—saw significant improvement over the month, with growth topping 1 percent and climbing as high as 2 percent in some places.

Of note in the September release: California finally returned to its historical stable range of housing activity for the first time in six years. The long-struggling state still has its challenges, however.

“[W]hile the state has made a strong comeback, we already see one of its four indicators elevated and showing that the typical family continues to have to stretch to buy a median priced house, especially in the Los Angeles metro area,” Kiefer said. “That said, far fewer homeowners are delinquent on their homes, the employment situation continues to improve and even purchase applications are beginning to turn around.”

Author: Tory Barringer December 1, 2014 http://dsnews.com/news/12-01-2014/freddie-mac-housing-market-inching-closer-stability?utm_source=DSNews.com&utm_campaign=488204d281-Your_Daily_Dose12_2_2014&utm_medium=email&utm_term=0_1924082bfe-488204d281-175200045

Come back tomorrow to http://www.AshfordCP.com/blog  where Kennesaw’s Ashford Capital Partners’ Managing Partners Matthew Riedemann brings you news you can use.

Flipping activity continues to decline as prime inventory dwindles

Kennesaw’s Ashford Capital Partners’ Managing Partners Matthew Riedemann brings you news you can use.

fliphouse

The third-quarter report from RealtyTrac on flipping shows that 26,947 single-family homes were flipped nationwide in the third quarter of 2014 — where a home is purchased and subsequently sold again within 12 months — representing 4% of all U.S. single-family home sales.

That’s down from 4.6% in the second quarter of 2014 and down from 5.6% in the third quarter of 2013 to the lowest level since the second quarter of 2009.

“Flipping returned to its historic norm of 4% in the third quarter as home price appreciation cooled in many of the hot flipping markets across the country,” said Daren Blomquist, vice president at RealtyTrac. “Meanwhile, the record-high average profits per flip in the quarter demonstrate that flippers are still filling an important niche in an aging housing market with historically low levels of new homes being built. The most successful flippers are buying older, outdated homes in established neighborhoods and rehabbing them extensively to appeal to modern tastes.”

Investors averaged a gross profit of $75,990 per flip on homes flipped in the third quarter of 2014, a 36% gross return on the initial investment — not including rehab costs and other expenses. The average gross return was up from 35% in the second quarter but down from 37% a year ago.

“Those discounted distressed properties have become harder to find, but a recent jump in scheduled foreclosure auctions could provide more fodder for flippers in the next three to six months,” Blomquist said.

Other high-level findings in the report:

  • Metro areas with the most flips in the third quarter were Miami (1,190 flips), Los Angeles (1,170 flips), Phoenix (1,147 flips), New York (1,070 flips) and Tampa (789 flips). Among these top five, Tampa was the only to post an increase in the share of home flips compared to a year ago.
  • Metros with an increasing share of home flips compared to a year ago included Louisville, Ky. (up 117%), Kansas City (up 66%), Boston (up 40%), New Orleans (up 38%), and Indianapolis (up 35%).
  • Markets with the best return on flips in the third quarter included Baltimore (88%), Pittsburgh (79%), Detroit (61%), Richmond, Va. (60%) and Mobile, Ala. (59%).
  • Metros with the highest dollar amount of average gross profit on home flips included San Francisco, San Jose, Los Angeles, New York, Seattle and San Diego, all of which had an average gross profit of more than $125,000 per flip.
  • Flips completed in the third quarter took an average of 185 days to complete, down slightly from 187 days in the previous quarter but up from an average of 133 days for flips completed in the third quarter of 2013.
  • Homes priced below $100,000 represented 20% of all homes flipped during the quarter, up from 19% of all sales in the second quarter and up from 18% of all sales in the third quarter of 2013.
  • Homes priced $100,000 to $400,000 represented 64% of all homes flipped during the quarter, down from 65% of all flips a year ago, while homes with a flipped price of $400,000 to $750,000 represented 12% of all flips, down from 13% a year ago. Flips on homes priced above $750,000 accounted for nearly 4% of all flips in the third quarter, down slightly from a year ago.
  • The best returns on homes flipped in the third quarter were on homes with a flipped sale price between $1 million and $2 million, yielding a 45% average gross return on investment. Homes in the $100,000 to $200,000 price range had the second best return at 43% followed by homes in the $200,000 to $300,000 price range with an average gross return of 41%.
  • Homes built before 1990 accounted for 73% of all home flips in the third quarter, up from 69% of all homes flipped a year ago. Homes built from 1990 to 1999 accounted for 10% of all homes flipped in the third quarter, while homes built in 2000 or later accounted for 17% of all homes flipped in the third quarter.
  • Homes built from 1930 to 1939 yielded a 53% gross return on investment for flips in the third quarter, the highest gross return of any decade going back to 1930. Homes built from 1950 to 1959 came in second with a 47% return.

“The practice of flipping has become much more difficult. The margins have been drastically reduced, since acquisition and rehab costs have increased,” said Rick Koentopp, real estate agent for RE/MAX Alliance, covering the Denver market. “With an extremely active market, the inventory of candidates has dwindled. The appetite to do the flips is very strong, but it is harder to identify the properties. Many flippers have to potentially accept lower margins, which increases the risk that is involved.”

Author:  Trey Garrison – http://www.housingwire.com/articles/32110-flipping-activity-continues-to-decline-as-prime-inventory-dwindles

Come back tomorrow to http://www.AshfordCP.com/blog  where Kennesaw’s Ashford Capital Partners’ Managing Partners Matthew Riedemann brings you news you can use.

Mortgage applications jump 4.9% after three weeks of declines

Refi share slips despite declining interest rates

stairs up

This week’s results included an adjustment for the Veterans Day holiday.

The Market Composite Index, a measure of mortgage loan application volume, increased 4.9% on a seasonally adjusted basis from one week earlier. On an unadjusted basis, the Index decreased 7% compared with the previous week.  The Refinance Index increased 1% from the previous week.

The seasonally adjusted Purchase Index increased 12% from one week earlier to the highest level since July 2014. The unadjusted Purchase Index decreased 3% compared with the previous week and was 6% lower than the same week one year ago.

The refinance share of mortgage activity decreased to 61% of total applications from 63% the previous week. The adjustable-rate mortgage (ARM) share of activity decreased to 6.9% of total applications.

The FHA share of total applications increased to 9.9% this week from 9.6% last week. The VA share of total applications increased to 11.5% this week from 11.0% last week.  The USDA share of total applications fell to 0.8% this week from 0.9% last week.

The average contract interest rate for 30-year fixed-rate mortgages with conforming loan balances ($417,000 or less) decreased to 4.18% from 4.19%, with points decreasing to 0.24 from  0.26 (including the origination fee) for 80% loan-to-value ratio (LTV) loans.

The effective rate decreased from last week. The average contract interest rate for 30-year fixed-rate mortgages with jumbo loan balances (greater than $417,000) decreased to 4.10% from 4.13%, with points increasing to 0.16 from 0.15 (including the origination fee) for 80% LTV loans.  The effective rate decreased from last week.

The average contract interest rate for 30-year fixed-rate mortgages backed by the FHA decreased to 3.85% from 3.90%, with points increasing to 0.18 from 0.14 (including the origination fee) for 80% LTV loans. The effective rate decreased from last week.

The average contract interest rate for 15-year fixed-rate mortgages remained unchanged from 3.38%, with points increasing to 0.27 from 0.22 (including the origination fee) for 80% LTV loans. The effective rate increased from last week.

The average contract interest rate for 5/1 ARMs increased to 3.09% from 3.05%, with points increasing to 0.34 from 0.32 (including the origination fee) for 80% LTV loans.  The effective rate increased from last week.

Author:  Trey Garrison – http://www.housingwire.com/articles/32100-mortgage-applications-jump-49-after-three-weeks-of-declines

Come back tomorrow to http://www.AshfordCP.com/blog  where Kennesaw’s Ashford Capital Partners’ Managing Partners Matthew Riedemann brings you news you can use.

Affordability: The issue for the middle class and millennials

Where Is Homeownership Within Reach of the Middle Class and Millennials?

Despite high household incomes, San Francisco is the least affordable metro, with just 15% of homes within reach of the middle class. Affordability has deteriorated over the past year in Austin and Miami. The most affordable markets are near the Great Lakes.

Where can the middle class bear the cost of buying a home? In the past year, affordability has fallen modestly, hurt by rising home prices, but helped by lower mortgage rates. Nationally, 59% of homes for sale are within reach of the middle class, compared with 62% last October. Nonetheless, the big picture is that prices still look undervalued compared with fundamentals and historically low mortgage rates make buying much cheaper than renting. Still, affordability is a growing problem.

We measure affordability as the share of homes for sale on Trulia within reach of a middle-class household. Our standard is whether the total monthly payment, including mortgage, insurance, and property taxes, is less than 31% of the metro area’s median household income. (See note below.) We define middle class separately for each metro based on the local median household income. Thus, what we consider affordable varies from market to market.

For instance, in metro Atlanta, median household income is $55,000. Homes priced under $276,000 are affordable based on the 31% guideline. On November 7, 2014, 71% of the homes for sale in Atlanta were listed for less than $276,000. That means that more than two-thirds of metro Atlanta homes are within reach of the middle class.

Austin and Miami Join California Markets on the Least Affordable List

The five most affordable markets are in Ohio, Indiana, and upstate New York. In those markets, more than 80% of homes for sale are within reach of the middle class. The South is relatively affordable too, with Birmingham, AL and Columbia, SC among the 10 most affordable markets.

Most Affordable Housing Markets for the Middle Class
↵ Return to site.

Most Affordable Housing Markets for the Middle Class
# U.S. Metro % of for-sale homes affordable for middle class, Nov 2014 Median size of affordable for-sale homes, Nov 2014 (square feet) % of for-sale homes affordable for middle class, Oct 2013
1 Dayton, OH 85% 1400 85%
2 Rochester, NY 83% 1400 76%
3 Akron, OH 83% 1350 86%
4 Gary, IN 81% 1500 84%
5 Toledo, OH 81% 1350 85%
6 Birmingham, AL 80% 1400 82%
7 Kansas City, MO-KS 79% 1400 80%
8 Camden, NJ 79% 1450 79%
9 Columbia, SC 79% 1700 83%
10 Detroit, MI 79% 1050 83%
Find out how affordable each of the 100 largest metros are for the Middle Class: Excel and PDF

Six of the seven least affordable markets are in California. A middle-class household can afford just 15% of homes for sale in San Francisco and 22% in Los Angeles. In New York, only 25% of homes for sale are within reach. Joining the least affordable list for the first time are Austin and Miami. In Austin, just 40% of homes for sale are within reach of the middle class, down from 50% last fall. Miami has seen a similar drop in affordability. In total, in 20 of the 100 largest metros, middle-class households can afford fewer than 50% of homes.

Least Affordable Housing Markets for the Middle Class
↵ Return to site.

Least Affordable Housing Markets for the Middle Class
# U.S. Metro % of for-sale homes affordable for middle class, Nov 2014 Median size of affordable for-sale homes, Nov 2014 (square feet) % of for-sale homes affordable for middle class, Oct 2013
1 San Francisco, CA 15% 1050 14%
2 Los Angeles, CA 22% 1250 24%
3 San Diego, CA 25% 1100 28%
4 New York, NY-NJ 25% 1050 25%
5 Orange County, CA 26% 1100 23%
6 San Jose, CA 30% 1200 31%
7 Ventura County, CA 33% 1250 32%
8 Honolulu, HI 38% 700 40%
9 Austin, TX 40% 1800 50%
10 Miami, FL 41% 1150 51%
Find out how affordable each of the 100 largest metros are for the Middle Class: Excel and PDF

metro map


Surprisingly, high-income metros are generally less, not more, affordable. Housing prices tend to be so high in metros with high incomes that affordability ends up being worse than in low-income metros. Why? High-income households bid up home prices, and high prices push out lower-income households. In addition, higher-income metros tend to have less new construction than lower-income metros do. As a result, high-income metros such as San Francisco and San Jose are among the least affordable, even after taking income into account.

Bucking the trend are Washington, DC and the Bethesda metro next door, where incomes are high and more than 60% of homes are within reach of the middle class.

HousingAffordability

The Least Affordable Parts of the Least Affordable Metros

Of course, affordability varies within metros. To dig deeper in the least affordable metros, we zoom down one level to look at sub-markets – individual counties or, for enormous counties like Los Angeles, the territories covered by telephone area codes. For example, although metro San Francisco is less affordable than metro New York, the borough of Manhattan is less affordable than the city of San Francisco (see note). In fact, Brooklyn and the San Gabriel Valley (east of downtown Los Angeles) are as unaffordable as the city of San Francisco.

So the next time someone says “Oakland is the new Brooklyn,” remind them that housing costs in Brooklyn actually rival those of San Francisco, not Oakland. In Alameda County, which includes Oakland, 32% of homes are within reach of the middle class – similar to Queens (33%), not Brooklyn (12%).

   Least Affordable Housing Sub-Markets for the Middle Class
↵ Return to site.

   Least Affordable Housing Sub-Markets for the Middle Class
# U.S. Sub-Market U.S. Metro % of for-sale homes affordable for middle class, Nov 2014
1 Manhattan NYC 2%
2 Pasadena / San Gabriel Valley (626) LA 11%
3 Brooklyn NYC 12%
4 San Francisco (city= county) SF 12%
5 Westside LA/ Beaches/ Coast (310/424) LA 14%
6 Marin SF 15%
7 Downtown LA (213) LA 16%
8 Napa SF 16%
9 San Fernando Valley (818/747) LA 16%
10 San Mateo SF 17%
Note: sub-markets are counties in most metros, including boroughs in New York, but are area code territories in metros where counties are unusually large.

Just Under Half of Homes are Within Reach of Millennials

For younger adults, affordability is yet a bigger challenge. Households headed by millennials – people younger than 35 – are at the age when people begin to think about buying a home. But their incomes are lower than those of older households. To explore affordability for this group, we use metro median income for millennial-headed households.

Nationwide, just 49% of for-sale homes are within reach of the median-income millennial household, compared with 59% for the median household regardless of age. In 45 of the 100 largest metros, the majority of homes for sale are beyond the reach of the typical millennial household. Those metros include not only expensive coastal markets such as Los Angeles and Honolulu, but also such places as Newark, Tucson, and Tacoma, WA. Austin and Oakland are among the 10 least affordable housing markets for millennials.

One surprise in this analysis: In two of the 100 largest metros – San Francisco and New York — the median income for millennial households is actually higher than median income for all households. Those markets have industries that often pay younger people well. But they also are such expensive markets that even well-paid young people must double up to be able to live there. Many find themselves priced out entirely. Even with those high-income millennials, San Francisco and New York are respectively the least and tenth-least affordable markets for millennials.

Least Affordable Housing Markets for Typical Millennial Household
↵ Return to site.

Least Affordable Housing Markets for Typical Millennial Household
# U.S. Metro % of for-sale homes affordable for median millennial household, Nov 2014 Median income, millennial households Median income, all households
1 San Francisco, CA 16% 90000 86000
2 Orange County, CA 17% 60000 76000
3 Los Angeles, CA 17% 48000 54000
4 San Diego, CA 18% 52000 61000
5 Ventura County, CA 20% 63000 78000
6 Austin, TX 22% 47000 62000
7 Honolulu, HI 25% 56000 73000
8 San Jose, CA 27% 87000 91000
9 Oakland, CA 27% 61000 76000
10 New York, NY-NJ 28% 60000 57000
Find out how affordable each of the 100 largest metros are for the Middle Class: Excel and PDF

For both millennials and the middle class generally, affordability is worsening. Annual home-price gains have slowed to 6.4% and will probably continue to ease. But that’s still a faster pace than gains in median income, which is rising at roughly the rate of inflation (1.5% in 2013). Plus, mortgage rates are likely to rise from their current low levels. Unless incomes increase substantially, homeownership will slip further beyond the reach of many households.

 http://www.ashford.wpsitecarepro.com/wp-admin/post-new.php

Note: We measure affordability as the share of homes for sale on Trulia on November 7, 2014, within reach of a middle-class household. Our standard is whether the total monthly payment, including mortgage, insurance, and property taxes, is less than 31% of the metro area’s median household income. We define middle class separately for each metro based on the local median household income. The total monthly cost includes the mortgage payment assuming a 4.2% 30-year fixed rate mortgage (versus 4.5% in the October 2013 calculation) with 20% down, property taxes based on average metro property tax rate, and insurance. We chose 31% of income as the affordability cutoff to be consistent with government guidelines for affordability. Both the Federal Housing Administration and the Home Affordable Modification Program use 31% of pre-tax income going toward monthly housing payments for assessing whether a home is within reach for a borrower.

Median household income is calculated from the 2013 American Community Survey (ACS) Public Use Microdata Sample (PUMS) using the 2009 metropolitan area definitions. Metro areas and divisions comprise one or more counties. In our sub-market analysis, we used counties or, in metros with very large counties like Los Angeles, the geographic footprints of telephone area codes.

Millennial households are those where the “reference person” (the head of household) is less than 35 years old.

Household incomes are rounded to the nearest $1000. Square footage is rounded to the nearest 50.

http://www.builderonline.com/newsletter/where-is-homeownership-within-reach-of-the-middle-class-and-millennials-trulia-trends_t?utm_source=newsletter&utm_content=jump&utm_medium=email&utm_campaign=BP_111814&day=2014-11-18&he=498224ece0da126f5bd427ff2cc3dce0f6c2a5ea

Come back tomorrow to http://www.AshfordCP.com/blog  where Kennesaw’s Ashford Capital Partners’ Managing Partners Matthew Riedemann brings you news you can use.

Building Boom Towns: Metro Areas With The Most New Construction In 2014

construction1_1200

While the rest of the country struggled to recover from the recession, the economy in Texas has been on fire. Thanks to a boom in horizontal drilling and fracking, the state’s oil output has more than doubled over the past three years to 3.18 million barrels per day—a level not seen since 1976.

That’s sparked a surge in construction around the nation’s oil capital, Houston–residential, manufacturing, office, and even the occasional hotel–a development that makes it a poster child for the construction recovery happening around the country.

All that oil has meant plenty of jobs: last year alone, Texas added about 300,000, my colleague Chris Helman reports, and Houston has gained about 630,000 jobs since 2005. The Houston metro area is stepping up to house them, with residential towers rising in the Inner Loop, the downtown neighborhoods bordered by Highway 610. Among the most notable projects is the $147 million, 40-story Market Square Apartments, which will have luxury amenities like a poker room and a sauna, and possibly a grocery store in the retail ground space. Meanwhile, home prices in the neighborhoods close to downtown are quickly rising.

In the first nine months of 2014, the greater Houston metro area welcomed groundbreakings on $25.1 billion worth of new construction projects, a 176% increase over the same period in the prior year, according to Dodge Data & Analytics.

Eight of the 10 biggest new construction projects (in terms of cost to build) are energy and chemicals facilities. The world’s biggest oil and chemicals companies have been rapidly expanding their Houston area plants to take advantage of cheap and plentiful chemical feedstocks like ethane, recovered from booming shale fields like the Eagle Ford. Among the new projects: a $3 billion Chevron CVX -0.56% Phillips ethane cracker in Baytown and a separate $3 billion polyethylene facility at the company’s site in Old Ocean, as well as a $3 billion Exxon Mobil XOM -0.42% project in Baytown and a $1.7 billion Dow Chemical DOW +1.98% project in Freeport.

The most high-profile real estate project at the moment is Exxon Mobil’s $1 billion campus north of Houston, which will house more than 10,000 workers. Started in 2012 (and thus not factored into this year’s construction total), the project sparked rumors that the company would move its corporate headquarters from Irving, Texas—speculation that Exxon’s CEO has refuted.

Thanks to all this activity, Houston jumps two spots to top our 2014 list of the U.S. cities with the most new construction.

“The [nationwide] construction expansion—which has been very hesitant to this point—is becoming more broad-based, which should enable it to become more resilient over the next year,” notes Robert Murray, chief economist and vice president at Dodge Data & Analytics (formerly McGraw Hill Construction).

To compile our list of Building Boom Towns, the folks at Dodge Data sorted through building data for the nation’s Metropolitan Statistical Areas to find the 20 places where the most money has been spent on new construction from the start of 2014 through September. (MSAs, which are delineated by the U.S. Office of Management and Budget, include cities and their surrounding suburbs.)

We looked at the dollar amount of new construction starts, or projects where ground has been broken and work begun, for structures that fall under the categories of single-family home construction, multi-family home construction, office space, retail space, warehouses, healthcare facilities, educational buildings, manufacturing plants and research facilities, among others. We did not include money spent on public works projects– bridges, streets and parks–nor did we include electric utility construction. Dodge Data defines a project’s total value as the cost to build a project at the time that construction starts (this doesn’t include land value or the cost of acquisition).

Note that while construction starts are considered a leading indicator of economic activity, they aren’t a certain representation of what will actually get built, since work could always stall if a developer loses financing or runs into other troubles. Case in point: the B2 modular tower at Atlantic Yards in Brooklyn, once touted as the world’s highest modular residential tower, now stalled amid lawsuits and construction problems.

Across the nation, new construction for the entire country was up 9% in 2013 to $535 billion, and Dodge projects it will climb another 5% to $564 billion in 2014. “The important shift is that non-residential building–which really had not shown any growth in 2012–began to show growth in 2013 and has been even stronger in 2014,” Murray says. “But to clarify, a lot of that has to do with manufacturing.”

Dodge estimates that through the end of 2014, construction starts in the manufacturing sector will be up 57% compared to 2013—and that’s after a 42% jump in the last year over 2012. By 2015, Dodge forecasts, the pace will drop by 16%, though even so the level of manufacturing building (mostly for oil and chemical companies) will be well ahead of historic norms.

Still, residential building remains the biggest chunk of the pie, forecast to account for about $227 billion in 2014’s total construction starts. Single-family residential construction has flat-lined this year, while permits for buildings with five or more units are on the rise, jumping in September to 353,000, up 18.5% over August. Dodge data shows apartment building starts rose 25% nationally from 2012 to 2013 and are forecast to climb another 22% through 2014. Overall, the firm estimates that residential building will grow by 8% this year, slower than in 2013 (up 26%) and 2012 (up 31%).

As the pace slows in residential, commercial is beginning to play a larger role in the construction upturn. This year Dodge forecasts commercial starts will climb 14%, compared to a 22% jump from 2012 to 2013. Financing for construction projects is becoming more available, thanks to easing in bank lending standards as well as the passage of more construction bonds. The total dollar value of starts for hotels and offices is up in 2014, while stores are up just barely. Institutional building – for example, of hospitals and schools – is also on the rise, after a flat 2013 it’s projected to increase by 4% in 2014.

Just behind booming Houston, the greater New York metro area takes the No. 2 slot for most new construction, after topping the list for two years running. A total of $23.3 billion in new construction starts graced the Big Apple in the first nine months of 2014, a 36% increase over the same period the prior year. The largest two are both in healthcare: the Helen L. and Martin S. Kimmel Pavilion Clinical Medical Facility at NYU and The David H. Koch Ambulatory Care Center at New York-Presbyterian Hospital on the Upper East side, both estimated at $800 million. Manhattan is also welcoming a number of new residential projects, many of them targeted at luxury buyers, including the Extell Development’s tall-and-skinny Nordstrom Tower on West 57th Street, which will rise 1,775 feet (one foot shorter than One World Trade Center) and cost about $718 million to build, according to Dodge.

Given the strength of Texas’ economy, perhaps it’s not surprising that three other Lone Star cities make the list of Top 20 Building Boom Towns: Dallas (No. 3), Austin (No. 13), and San Antonio (No. 19)

Dallas, which welcomed $10.8 billion in new construction in 2014’s first nine months, nabs the No. 3 spot, with less than half the new construction seen in Houston or New York. Still, that city is experiencing an increase in projects breaking ground across industries: the $170 million mixed-use development of office, retail, and apartments at Olive and McKinney in downtown Dallas, as well as the new, $150 million six-story tower at the Cook Children’s Medical Center’s Fort Worth campus.

Author: Erin Carlyle – http://www.forbes.com/sites/erincarlyle/2014/11/11/building-boom-towns-metro-areas-with-the-most-new-construction-in-2014/

Come back tomorrow to http://www.AshfordCP.com/blog  where Kennesaw’s Ashford Capital Partners’ Managing Partners Matthew Riedemann brings you news you can use.


1960s Kit House Revamp Brings New Life to Vintage Modernism-on-a-Budget


A weekend-house remodel uncovers a neglected Long Island gem.

“First, do no harm.” A foundation of medical practice, that principle applies equally to the remodeler’s art. Especially in cases like this one, a weekend home in Amagansett, N.Y., whose humble origins and tired finishes might have marked it for demolition. “It was a kit house that was sold through the local lumberyard in the 1960s,” says architect Paul Masi, of Bates Masi + Architects, in Sag Harbor, N.Y. 

Starter Kit.  A standard kit home from the 1960s served as the starting point for architect Paul Masi’s thoughtful modern transformation to better suit the homeowners’ lifestyle.
Starter Kit. A standard kit home from the 1960s served as the starting point for architect Paul Masi’s thoughtful modern transformation to better suit the homeowners’ lifestyle.

On closer inspection, Masi found much to like in this vintage version of modernism on a budget. “It didn’t really fit the owners’ lifestyle as it was,” he says, “but it had a good structure and a nice, simple layout.” Building on those inherent virtues, Masi and general contractor Brian Mannix, of Mannix Custom Builders, in Amagansett, conducted a thorough yet restrained remodel that transformed a bit player into a real heartthrob, which won a Grand Award for Whole-House Remodeling $250,000–$500,000 in the 2014 Remodeling Design Awards. (See a slide show of this project and the other 2014 Design Award winners online in Remodeling’s Project Gallery.)

A Few Good Moves

The core of the original house consisted of a living space with an open ceiling above a high clerestory. Flanking that central element were two lower wings containing a kitchen, a dining area, four bedrooms, and three bathrooms. “The structure had a nice rationale,” Masi says. “It had some volume in its main space and a fair amount of glazing. And it was quite efficient; there were almost no hallways in the house.” As a result, Masi was able to retain the building’s basic interior layout with only a few judicious adjustments. The new floor plan shifts the kitchen and dining area toward the center of the house, freeing up space for a new media room, and includes only enough new area for a larger master bath.

Chiaroscuro Effect.  A tier of clerestory windows wraps around the dining and living rooms, providing a sense of separation between walls and roof plane. The window frames, which match the dark-stained exterior siding, highlight the contrast between structure and openings.

Changes to the building’s structural shell were similarly restrained. Expanded window area—all of the glazing in the house is new—exposes more of the structural frame (the new roof over the master bathroom follows suit, with a tier of clerestory windows all around). Dark-stained cedar siding and matching window frames highlight the contrast between structure and openings. A reconfigured deck spans the home’s rear elevation, punching out at its center to accentuate the building’s basic symmetry. Mannix removed a brick patio and gave the existing swimming pool a narrow apron of cut stone surrounded by a carpet of grass. In keeping with the spirit of the original house, Masi says, his design approach was “just about keeping it simple.”

Grace Notes

While Mannix saved the bones of the house, he took a wrecking bar to its existing finishes. “We gutted the entire house down to the frame,” says the builder, who updated the home’s plumbing, electrical, and mechanical system, and replaced the existing lumberyard-grade interior with an abbreviated palette of earthy, natural materials. The dark cedar of the exterior extends into the house, wrapping the exposed ceiling beams and framing the clerestory windows. Wall paneling and cabinetry fabricated from weathered barn boards highlight Masi’s simple modernist detailing. “We felt like there were a lot of areas that we Sheetrocked,” Masi says, “and this became a counterbalance.”

Light Touch.  A program of deceptively subtle interventions—increased glazing area, better-integrated finish colors, and a modest addition—reveal the underlying strength of the home’s original design.

At the kitchen island, barn board panels and a volcanic stone countertop frame prefabricated laminate cabinets. “We just clad the boxes,” explains Masi, who says that simple stock cabinets represent an attractive, cost-saving option, even for high-style installations like this one. “You’ve just got to find a way to balance them using other materials,” he says. A volcanic stone tile backsplash lines a recess in the opposite wall, which holds another run of laminate cabinets and a pair of weathered plank shelves with hidden cantilevered supports.

The exposed brick chimney, which stands prominently at the center of the living room’s entry wall, gained a bit of artificial aging. “It had a sort of patina that was starting to be interesting, but it wasn’t quite there yet,” Masi says, “so we added some paint and rubbed it off. We did that over and over. It was sort of this layering process.”

Bound for Glory

The project’s most distinctive feature is its use of a material not usually associated with residential interiors: manila rope. Masi specified the rope as a finish and accent throughout the house. Mannix fastened CNC-milled “looms” to the sides of the roof beams and wove the rope back and forth to form continuous screens. The assemblies create visual interest overhead, tying together the home’s existing and new elements. By dampening sound, they also create a warmer environment for music, which is an important consideration for the owners, one of whom is a professional DJ. “There’s quite a lot of glass there, and glass is such a reflective surface,” Masi says. “[The loomed rope] helps balance that out.”

Woven rope also fills the wood-framed sliding door between the master bedroom and the bath, and appears to suspend the long mirror over the master bath vanity. “In a lot of our projects we try to come up with a concept that’s going to carry through not just the big elements, but also the smaller details,” Masi explains. And while he had never worked with rope before, it wasn’t his first experiment with unconventional materials. “Our projects have a tendency to drive us into products and industries that we’ve never delved into,” he says. Fortunately, a member of the crew had relevant experience. “One of the guys was a fisherman,” Mannix says, “I used him specifically because he knew how to work with the rope.”

Sense of Intimacy

The only entirely new room in the house, the master bath offered additional opportunities for creativity. The space centers on a barn board–clad vanity wall, which also encloses the shower and toilet area. Because the wall stops short of the ceiling, Mannix explains, it depends on cantilevered posts that extend into the floor framing for lateral rigidity. “I ran engineered lumber at the corners, straight through the floor, and sheathed the wall with plywood,” he says.

Personal Space.  A slightly expanded building footprint accommodates a high-ceilinged master bathroom. Woven rope fills the spaces between the exposed roof beams. A sliding screen of the same material provides privacy at the tub.

Mannix lined two of the shower walls with stone tile and two with barn boards sealed behind sheets of glass. “We simply laid the glass on top of the wood and siliconed all the corners,” he says, “just like a standard frameless shower stall.” The result is as watertight and easy to clean as a conventional installation, he says, but “it has a very raw feel to it.”

Come back tomorrow to http://www.AshfordCP.com/blog  where Kennesaw’s Ashford Capital Partners’ Managing Partners Matthew Riedemann brings you news you can use.

From National to Local Races, NAHB Members Win Office on Election Day

votebuttomAs the 2014 election results roll in from all the local, state and national races across the country, NAHB members demonstrated that they are deeply involved in the political process by not only supporting pro-housing candidates but by throwing their hat in the political ring and winning elected office in a number of races.

Regardless of whether they won or lost, NAHB wishes to congratulate all of our members who fought for housing and ran for public office.

Led by Maryland Governor-elect Larry Hogan (R) and Pennsylvania Governor-elect Tom Wolf (D) (under his firm’s name The Wolf Organization), more than two dozen NAHB members were elected to various government posts across the nation on Nov. 4.

Also on the national stage, Republican Steve Daines, who literally grew up in the home building industry, was elected to the U.S. Senate seat in Montana. His father, Clair Danes, is an NAHB board member.

In South Carolina, Rep. Joe Wilson won re-election to the U.S. House of Representatives.

NAHB also wishes to congratulate the following members who won their local elections:

Name                                    State               Elected Position
Geoff Duncan (R)                  Ga.                   State House of Representatives, District 26
Dale DeVon (R)                     Ind.                 State House of Representatives
Doug Miller (R)                      Ind.                  State House of Representatives
Wes Culver (R)                      Ind.                  State House of Representatives
Heath VanNatter (R)              Ind.                  State House of Representatives
Mark Messmer (R)                 Ind.                  State Senator
Tommy Thompson (D)          Ky.                  Majority Whip, Kentucky House of Representatives
Glenn Stuckel (R)                 Ky.                  Louisville Metro Council
Reagan Taylor (R)                 Ky.                  County Judge Executive, Madison County
Ruth Ann Palumbo (D)          Ky.                  House of Representatives, Lexington
Chris McDaniel (R)                Ky.                  State Senator
Margaret O’Brien (R)           Mich.               Senator-elect, State Senate
Tama Theis (R)                    Minn.             House of Representatives, St. Cloud
Wesley Meredith (R)            N.C.                State Senator
Harry Brown (R)                  N.C.                State Senator
Tommy Tucker (R)               N.C.                State Senator
Jonathan Jordan (R)             N.C.               State House Representative
Greg West                           N.C.               Cumberland County Board of Education
Hugh Leatherman, Sr.(R)     S.C.                State Senator
Nathan Ballentine (R)          S.C.                State House of Representatives, District 71
Ralph Norman (R)               S.C.                State House of Representatives, District 48
Brandon Creighton (R)         Texas             State Senate, District 4
Trent Ashby (R)                   Texas             State House of Representatives, District 57
John Frullo (R)                     Texas             State House of Representatives, District 84
Jose Menendez (D)               Texas             State House of Representatives, District 124
John Wray (R)                      Texas             State House of Representatives, District 10
Dennis Bonnen (R)               Texas              State House of Representatives, District 25
Drew Darby (R)                    Texas              State House of Representatives, District 72
Paul Espinosa (R)                W.Va.             Representative, West Virginia House of Delegates
Dan Dulyea (R)                   W.Va.            Councilmen-elect, Berkeley County Council
Roger Roth (R)                     Wis.               State Senator
Bob Kulp (R)                         Wis.               State Assembly
Paul Tittl (R)                         Wis.                State Assembly

Housing is an American Issue

Housing is neither a Democratic nor a Republican issue. It’s an American issue. This is why NAHB is officially a non-partisan association. We support housing-friendly candidates on both sides of the aisle, regardless of party affiliation.

Short of running for office, staying politically active by helping get out the vote for housing-friendly candidates and contributing to BUILD-PAC is the best possible way to lay the foundation for future success that will benefit our industry and nation.

If you attended a fundraiser, campaigned door to door, put up signs on your lawn, made phone calls or wrote a check, your contributions helped to make housing’s presence all the stronger and all the more effective on Election Day.

by on November 8, 2014 – http://nahbnow.com/2014/11/from-national-to-local-races-nahb-members-win-office-on-election-day/

Come back tomorrow to http://www.AshfordCP.com/blog  where Kennesaw’s Ashford Capital Partners’ Managing Partners Matthew Riedemann brings you news you can use.

Report: Non-Mortgage Debt Dragging Homeownership Even With Lower Down Payment

Non-Mortgage Debt Home OwnershipWhile lowering the down payment on a mortgage may clear one major hurdle to homeownership, a report released by RealtyTrac Tuesday revealed that a monthly mortgage payment is affordable to those with additional non-mortgage debt in less than half of the counties in the U.S.

In an analysis of housing affordability in 512 U.S. counties with a combined population of 235 million, RealtyTrac discovered that lowering the down payment for a conventional mortgage loan from 20 percent to 3 percent, as has been discussed recently by Federal Housing Finance Agency Director Mel Watt, would still not translate to housing affordability for a majority of those with non-mortgage debt such as student loans or a car payment.

“While lower down payments may help pave a quicker path to homeownership for some prospective homebuyers, a bigger obstacle to homeownership is the additional non-mortgage debt many borrowers bring to the table,” said Daren Blomquist, VP at RealtyTrac. “For borrowers without additional debt, monthly house payments are affordable in more than 90 percent of U.S. housing markets — whether they make a 20 percent or 3 percent down payment. But for borrowers with the additional debt burden of student loans and car payments, monthly house payments are affordable in less than half of U.S. housing markets with a 3 percent down payment.”

RealtyTrac found that it would take an average of less than two years to save up for a 3 percent down payment on a mortgage loan compared to 12 and a half years to save up for a 20 percent down payment at an annual savings rate of 5.6 percent (as reported by the St. Louis Federal Reserve).

However, once the down payment hurdle is cleared, making the monthly mortgage payment becomes a problem for those with additional debt. RealtyTrac’s report found that for those without additional debt, the monthly mortgage payment was still affordable in 92 percent of county housing markets even with just a 3 percent down payment. But for those with an average monthly car payment and an average monthly student loan payment, RealtyTrac found that the monthly mortgage payment was affordable in only 48 percent of county housing markets when a 3 percent down payment was made.

The percentage of borrowers in county housing markets who can afford the monthly mortgage payment jumps from 48 percent to 78 percent for those with an average car payment and an average student loan payment when they make a 20 percent down payment, according to RealtyTrac. For those without additional debt who make a 20 percent down payment, housing was affordable in 96 percent of county housing markets.

The average car payment was $471 as of Q4 2013, according to Experian Automotive, and the average student loan payment was $321 for 2012 college graduates with an average student loan debt of $29,400, according to Project on Student Loan Debt.

The RealtyTrac report found that according to Down Payment Resource, there are more than 2,300 down payment and closing cost assistance programs available nationwide and that 60 to 80 percent of homes in most areas would qualify for assistance from one of these programs. Also, the report found the average amount of assistance from these programs was $19,720, and could be as high as $50,000 to $100,000 in some high cost areas.

“The narrative is that it’s too hard to get a loan today and when first-time buyers believe that, they won’t even begin their search. That hurts the overall housing market,” Rob Chrane of Down Payment Resource said. “Consumers for the most part have no idea that these programs exist, so they don’t think to ask for them. Whatever your situation is, whatever you have for a down payment, you could be in a much better situation if you find out you are eligible for one of these programs.”

Author: Brian Honea November 4, 2014 http://dsnews.com/news/11-04-2014/report-non-mortgage-debt-dragging-homeownership-even-lower-payment?utm_source=DSNews.com&utm_campaign=630413dfb7-Your_Daily_Dose11_5_2014&utm_medium=email&utm_term=0_1924082bfe-630413dfb7-175200045

Come back tomorrow to http://www.AshfordCP.com/blog  where Kennesaw’s Ashford Capital Partners’ Managing Partners Matthew Riedemann brings you news you can use.

The Next Housing Crisis May Be Sooner Than You Think

How we could fall into another housing crisis before we’ve fully pulled out of the 2008 one.

Image

Reuters/Brodsky Development

When it comes to housing, sometimes it seems we never learn. Just when America appeared to be recovering from the last housing crisis—the trigger, in many ways, for 2008’s grand financial meltdown and the beginning of a three-year recession—another one may be looming on the horizon.

There are at several big red flags.

For one, the housing market never truly recovered from the recession. Trulia Chief Economist Jed Kolko points out that, while the third quarter of 2014 saw improvement in a number of housing key barometers, none have returned to normal, pre-recession levels. Existing home sales are now 80 percent of the way back to normal, while home prices are stuck at 75 percent back, remaining undervalued by 3.4 percent. More troublingly, new construction is less than halfway (49 percent) back to normal. Kolko also notes that the fundamental building blocks of the economy, including employment levels, income and household formation, have also been slow to improve. “In this recovery, jobs and housing can’t get what they need from each other,” he writes.

Second, Americans continue to overspend on housing. Even as the economy drags itself out of its recession, a spate of reports show that families are having a harder and harder time paying for housing. Part of the problem is that Americans continue to want more space in bigger homes, and not just in the suburbs but in urban areas, as well. Americans more than 33 percent of their income on housing in 2013, up nearly 13 percent from two decades ago, according to newly released data from the Bureau of Labor Statistics (BLS). The graph below plots the trend by age.

Over-spending on housing is far worse in some places than others; the housing market and its recovery remain highly uneven. Another BLS report released last month showed that households in Washington, D.C., spent nearly twice as much on housing ($17,603) as those in Cleveland, Ohio ($9,061). The chart below, from the BLS report, shows average annual expenses on housing related items:

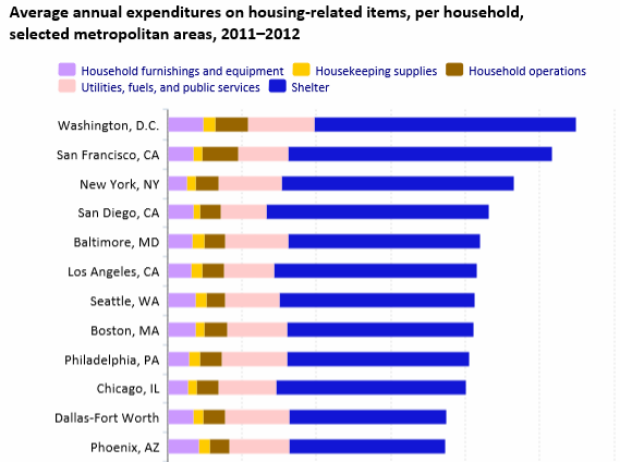
(Bureau of Labor Statistics)

The result, of course, is that more and more American households, especially middle- and working-class people, are having a harder time affording housing. This is particularly the case in reviving urban centers, as more affluent, highly educated and creative-class workers snap up the best spaces, particularly those along convenient transit, pushing the service and working class further out.

Last but certainly not least, the rate of homeownership continues to fall, and dramatically. Homeownership has reached its lowest level in two decades—64.4 percent (as of the third quarter of 2014). Here’s the data, from the U.S. Census Bureau:

(Data from U.S. Census Bureau)

Homeownership currently hovers from the mid-50 to low-60 percent range in some of the most highly productive and innovative metros in this country—places like San Francisco, New York, and Los Angeles. This range seems “to provide the flexibility of rental and ownership options required for a fast-paced, rapidly changing knowledge economy. Widespread homeownership is no longer the key to a thriving economy,” I’ve written.

What we are going through is much more than a generational shift or simple lifestyle change. It’s a deep economic shift—I’ve called it the Great Reset. It entails a shift away from the economic system, population patterns and geographic layout of the old suburban growth model, which was deeply connected to old industrial economy, toward a new kind of denser, more urban growth more in line with today’s knowledge economy. We remain in the early stages of this reset. If history is any guide, the complete shift will take a generation or so.

The upshot, as the Nobel Prize winner Edmund Phelps has written, is that it is time for Americans to get over their house passion. The new knowledge economy requires we spend less on housing and cars, and more on education, human capital and innovation—exactly those inputs that fuel the new economic and social system.

But we’re not moving in that direction; in fact, we appear to be going the other way. This past weekend, Peter J. Wallison pointed out in a New York Times op-ed that federal regulators moved back off tougher mortgage-underwriting standards brought on by 2010’s Dodd-Frank Act and instead relaxed them. Regulators are hoping to encourage more homeownership, but they’re essentially recreating the conditions that led to 2008’s crash.

Wallison notes that this amounts to “underwriting the next housing crisis.” He’s right: It’s time to impose stricter underwriting standards and encourage the dense, mixed-use, more flexible housing options that the knowledge economy requires.

During the depression and after World War II, this country’s leaders pioneered a series of purposeful and ultimately game-changing polices that set in motion the old suburban growth model, helping propel the industrial economy and creating a middle class of workers and owners. Now that our economy has changed again, we need to do the same for the denser urban growth model, creating more flexible housing system that can help bolster today’s economy.

Come back tomorrow to http://www.AshfordCP.com/blog  where Kennesaw’s Ashford Capital Partners’ Managing Partners Matthew Riedemann brings you news you can use.